Beyond the Numbers IntroductionThe Indigenous Peoples of Canada who live in northern or remote regions have difficulties achieving the necessities for optimal health. As a result of long chains of supply and distribution, food remains very expensive. It is estimated generally that 33% of Indigenous Populations are food insecure and depending on some reservations that rate could reach as high as 75.5% (Subnath, 2017, p.10). Food like fruit or vegetables are needed to maintain or increase good health and getting more expensive. Other food options are calorie dense but lack important vitamins and minerals (Racco, 2017, para.4). Efforts like Nutrition North are underway to remedy this and there have been setbacks (Murray, 2018, para.9). As prices for food continue to increase, what is being observed in Indigenous communities may become more likely in contemporary society. Consumer Price Index Every month, Statistics Canada puts out a report which details the average price food across the country. As of December 1, the current average of change over last year is set at 2.0% (Statistics Canada, 2018, Table 18-10-0004-03). This means that there is an increase of 2.0% over the cost last year. When we break down this number, we find that other classes of food are lower or higher depending on the category. When we observe the numbers for each of these classes, we find that fruits and vegetables are among the costliest. Fresh fruit stands at 1.5% but the sub category for oranges stands at 9.6% (Statistics Canada, 2018, Table 18-10-0004-03). Fresh vegetables stand at 11.3%, with tomatoes at 16.6% and Lettuce at 14.4% (Statistics Canada, 2018, Table 18-10-0004-03). Fruits and Vegetables show an almost 5 times increase over last year and we can infer that these costs can add up. AlbertaThere are provincial price differences and the classes reported by Statistics Canada are not as detailed as in previous versions of the data. Recently, Statistics Canada has not been updating sub classes and other than general numbers, we cannot observe the rates for specific classes. Fresh vegetables stands out at 9.3% over last year (Statistics Canada, 2018, Table 18-10-0004-03). The graph below show a 1.5% increase over last year (Alberta Government, 2018, Consumer Price Index Change). We expect this rate to increase considering declining production numbers. It would be interesting to note what effect the world wide potato shortage has on Alberta prices considering our production numbers were not affected by the downturn experienced world wide (Ross, 2018, para.3). 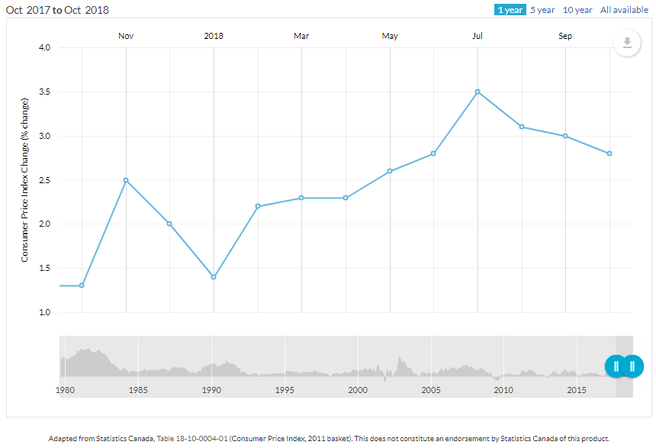 TrendsWe can look to Indigenous populations and their struggle with above average food insecurity and these trends we observe are applicable to general society. If present trends continue, we may face conditions not unlike those experienced in northern or remote regions. For example, I visited a supermarket on a reserve that had a bag of mandarin oranges selling for $7.99. That same bag was selling at a Walmart for $3.99. A 63 km difference and a $4.00 difference make eating healthy difficult to accomplish. How does one cope when on a fixed income or those experiencing poverty? As a society, we are getting more unhealthy because of the food habits we have and where the trends are taking us. Processed food is generally much more affordable and in recent years the intake of processed food has increased dramatically by about almost 50% (Racco, 2018, para.1). The foods we need to maintain or increase our health are getting more expensive. The health situation experienced by those living in northern or remote regions is a direct consequence of eating unhealthy. The next blog post will discuss the long term health consequences of not eating healthy. ReferencesAlberta Government (2018). Consumer Price Index Change [Graph]. Retrieved from https://economicdashboard.alberta.ca/ConsumerPriceIndexChange
Kenny, T. A., Fillion, M., MacLean, J., Wesche, S. D., & Chan, H. M. (2018). Calories are cheap, nutrients are expensive–The challenge of healthy living in Arctic communities. Food Policy, 80, 39-54. Murray, N. (2018, October 19). 'Tokenism and optics': Inuit orgs slam feds on Nutrition North consultations. Retrieved from https://www.cbc.ca/news/canada/north/inuit-groups-indigenous-working-group-nutrition-north-1.4869314 Racco, M. (2017, December 5). Canadians, especially kids, get half their daily calories from ultra-processed foods. Retrieved from https://globalnews.ca/news/3898015/canada-kids-processed-food/ Ross, S. (2018, November 28). Price of potatoes expected to go up, says P.E.I. grower. Retrieved from https://www.cbc.ca/news/canada/prince-edward-island/pei-potato-harvest-prices-shortage-1.4923905 Statistics Canada (2018). Consumer Price Index, monthly, not seasonally adjusted, Canada, provinces, Whitehorse and Yellowknife — Food [Table]. Retrieved from https://www150.statcan.gc.ca/t1/tbl1/en/tv.action?pid=1810000403 Subnath, M. (2017). Indigenous Food Insecurity in Canada: An Analysis Using the 2012 Aboriginal Peoples Survey. Retrieved from https://ir.lib.uwo.ca/cgi/viewcontent.cgi?article=6275&context=etd
0 Comments
Leave a Reply. |
AuthorWrite something about yourself. No need to be fancy, just an overview. Archives
March 2022
Categories |
 RSS Feed