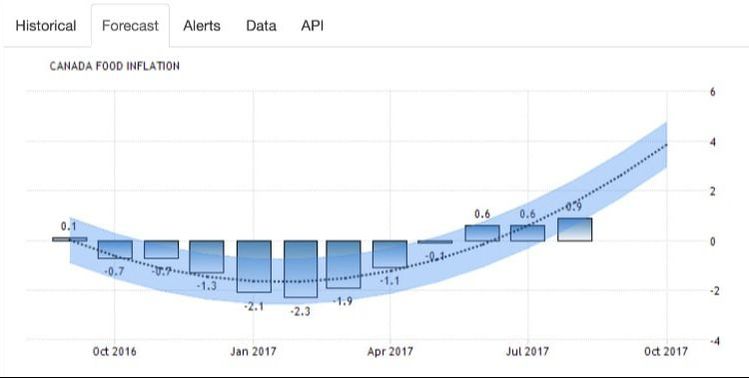
 Source : https://tradingeconomics.com/canada/food-inflation/forecast Food Inflation This graph represents the inflation for foods compared to this time last year. 0.9% is the latest reported number for August. This number is an average of different classes of food. This number in itself is not alarming but when we closely examine certain classes of food it reveals that nutritious foods are getting more expensive. Breakdown The data set from which this graph is constructed is from the Consumer Price Index, for Food, from Statistics Canada. The index tracks and categorizes 32 different classes of foods, ranging from type of food (food groups) to food service provided businesses. Nationally, the classes of food that has seen a marked increase from August of last year is fish, fresh fruit, and fresh vegetables. The rate for fish was listed at 5.1%. For fresh fruit, it was at 5.6%. While for fresh vegetables, the rate was at 3.6%. Meat rose 1.1%. What is even more startling is when we compare these rates to our provincial stats, the difference becomes more alarming. Fish is listed at 5.3%, while fresh fruit is listed at 7.9%, and fresh vegetables are at 7.1%. Bucking the trend, meat is at -0.6%. Takeaway Up to now, it has been maintained generally that food has become more affordable but for certain types of food that is not the case. If one wishes to eat healthy, these classes of food are what is consumed in order to maintain or increase health. Since last year, it has been significantly harder to eat healthier but easier to purchase sugary or processed foods.
Price becomes an obstacle to eating healthy, especially to those who are experiencing low income conditions. Consumption of food that is affordable but nutritiously low can have long term health effects. Recent studies examining the relationship between nutrition and mental health suggest that eating health is correlated with greater positive mental health. When we look to the forecast graph above, from tradingeconomics.com, the dotted blue covered line represents a forecast. Nationally for October, we are looking at almost a 4% increase from last year and considering the provincial trend this number might be higher. In terms of buying food, it is about to get more expensive. Derek Melting Tallow https://www.facebook.com/SYF2017/
1 Comment
|
AuthorWrite something about yourself. No need to be fancy, just an overview. Archives
March 2022
Categories |
 RSS Feed