Developing Extremes IntroductionFor historical context, we must note that the establishment of the many reserves was structurally designed for a purpose. Mary Kelm asserts that the government knew the structure of the reserve system was design to limit access to resources (Kelm, 1999, p.27). This was to foster dependence on government resources and initiate a change in culture. In the late 1800’s and early 1900’s, the belief was that Indigenous Peoples were going extinct and those that remained needed to modernize, i.e. residential school system. The food insecurity experienced by northern and remote reserves a consequence of colonialism. Northern and Remote
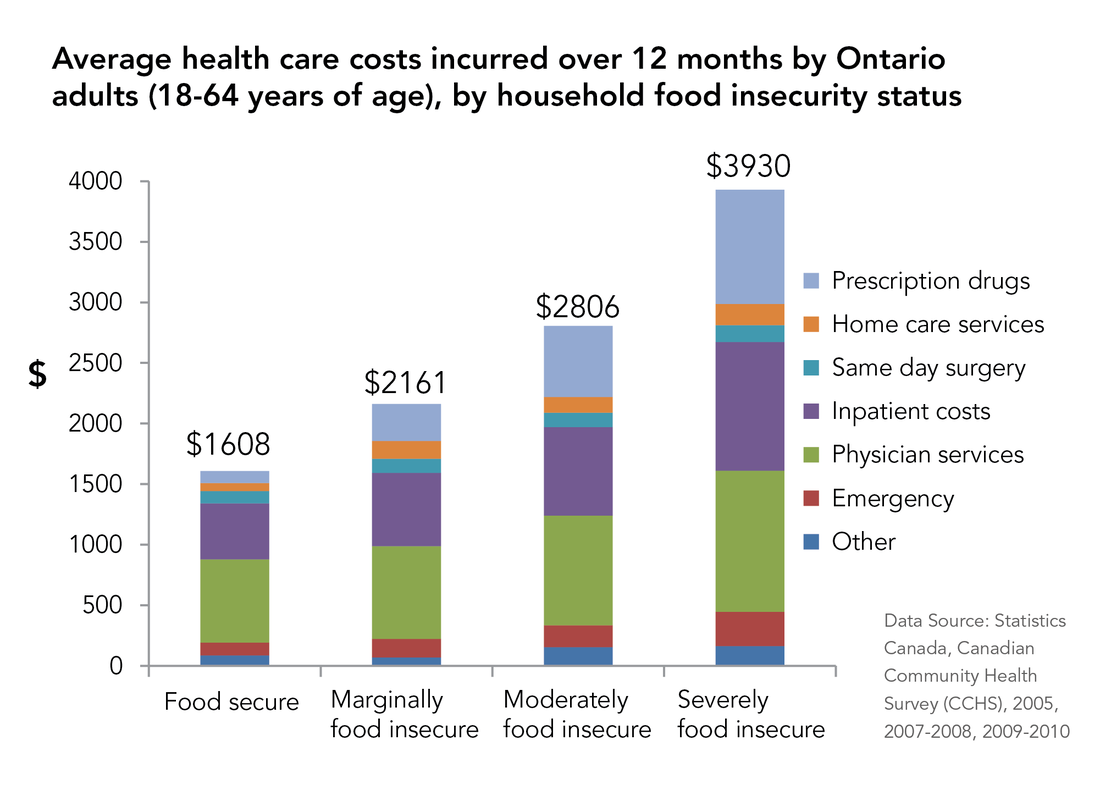
Health Costs Imagine being on a fixed income and in the face of high prices, what would be your strategy? One would buy what was available and cheap. Processed foods, which are calorie dense, high in sodium, and low in nutrition is more affordable and has seen an increase in consumption by about 50% (Racco, 2018, para.1). The long term effect of eating processed food has been demonstrated to result in adverse outcomes. The consumption of processed foods is cheap, plentiful, and time efficient. Researchers have found that the intake of processed foods resulted in increased fats, sugar, and salt consumption and decreased intake of fiber, vitamins, and minerals (Moubarac et al., 2017, p.7). The authors of this report conclude that nutritional imbalances present in the Canadian Diet is a result of increased consumption of processed food and stress a return to handmade, unprocessed food product (Moubarac et al., 2017, p.10). One final piece to the food insecurity puzzle is the availability of health services to address the health outcomes of the food insecure diet. Another finding from the Food Secure Canada report on northern and remote reserves are access to health services are limited (Food Secure Canada, 2016, p.5). The following graphic is from PROOF Toronto and illustrates how food security and health outcomes are tied, in the province of Ontario. Those experiencing food insecurity have double the health issues than those who are not food insecure. Conclusion Experts in the field cite the global population increase, declining production numbers, agriculture tech limitations, and already maximized land use will result in food shortages. In Sarah Menker’s TedX Talk, she believes we are less than a decade before we see food become expensive and unavailable (Menker, 2017). What would this look like in contemporary Canadian society?
The purpose of this blog post is to demonstrate the long term consequence of food insecurity. We can look to these examples on Northern and Remote tribal reservations to illustrate these conditions. The health outcomes are tied to the quality of food that is consumed. Urban areas are beginning to feel the pinch and much has to do with the orientation and structure of the food system currently being used, which will be the subject of our next blog posting. References Food Secure Canada (2017). Paying for Nutrition: A Report on Food Costing in the North. Retrieved from https://foodsecurecanada.org/sites/foodsecurecanada.org/files/201609_paying_for_nutrition_fsc_report_final.pdf Kelm, M. E. (1999). Colonizing bodies: Aboriginal health and healing in British Columbia, 1900-50. UBC press. Menker, S. (2017). A global food crisis may be less than a decade away. Retrieved from https://www.ted.com/talks/sara_menker_a_global_food_crisis_may_be_only_a_decade_away?language=en Moubarac, J. C., Batal, M., Louzada, M. L., Steele, E. M., & Monteiro, C. A. (2017). Consumption of ultra-processed foods predicts diet quality in Canada. Appetite, 108, 512-520. Racco, M. (2017, December 5). Canadians, especially kids, get half their daily calories from ultra-processed foods. Retrieved from https://globalnews.ca/news/3898015/canada-kids-processed-food/
0 Comments
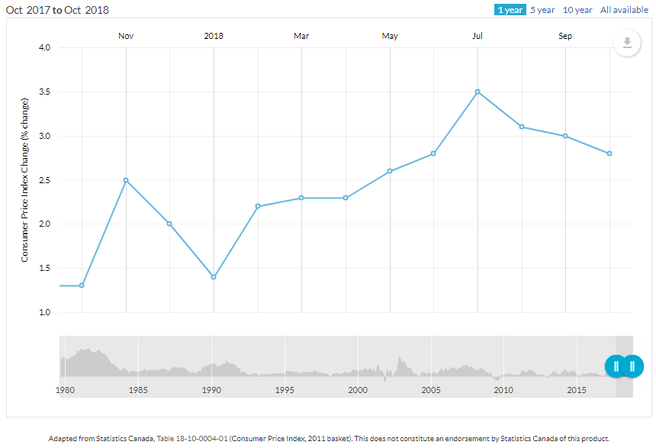
Beyond the NumbersIntroductionThe Indigenous Peoples of Canada who live in northern or remote regions have difficulties achieving the necessities for optimal health. As a result of long chains of supply and distribution, food remains very expensive. It is estimated generally that 33% of Indigenous Populations are food insecure and depending on some reservations that rate could reach as high as 75.5% (Subnath, 2017, p.10). Food like fruit or vegetables are needed to maintain or increase good health and getting more expensive. Other food options are calorie dense but lack important vitamins and minerals (Racco, 2017, para.4). Efforts like Nutrition North are underway to remedy this and there have been setbacks (Murray, 2018, para.9). As prices for food continue to increase, what is being observed in Indigenous communities may become more likely in contemporary society. Consumer Price IndexEvery month, Statistics Canada puts out a report which details the average price food across the country. As of December 1, the current average of change over last year is set at 2.0% (Statistics Canada, 2018, Table 18-10-0004-03). This means that there is an increase of 2.0% over the cost last year. When we break down this number, we find that other classes of food are lower or higher depending on the category. When we observe the numbers for each of these classes, we find that fruits and vegetables are among the costliest. Fresh fruit stands at 1.5% but the sub category for oranges stands at 9.6% (Statistics Canada, 2018, Table 18-10-0004-03). Fresh vegetables stand at 11.3%, with tomatoes at 16.6% and Lettuce at 14.4% (Statistics Canada, 2018, Table 18-10-0004-03). Fruits and Vegetables show an almost 5 times increase over last year and we can infer that these costs can add up. AlbertaThere are provincial price differences and the classes reported by Statistics Canada are not as detailed as in previous versions of the data. Recently, Statistics Canada has not been updating sub classes and other than general numbers, we cannot observe the rates for specific classes. Fresh vegetables stands out at 9.3% over last year (Statistics Canada, 2018, Table 18-10-0004-03). The graph below show a 1.5% increase over last year (Alberta Government, 2018, Consumer Price Index Change). We expect this rate to increase considering declining production numbers. It would be interesting to note what effect the world wide potato shortage has on Alberta prices considering our production numbers were not affected by the downturn experienced world wide (Ross, 2018, para.3). TrendsWe can look to Indigenous populations and their struggle with above average food insecurity and these trends we observe are applicable to general society. If present trends continue, we may face conditions not unlike those experienced in northern or remote regions. For example, I visited a supermarket on a reserve that had a bag of mandarin oranges selling for $7.99. That same bag was selling at a Walmart for $3.99. A 63 km difference and a $4.00 difference make eating healthy difficult to accomplish. How does one cope when on a fixed income or those experiencing poverty? As a society, we are getting more unhealthy because of the food habits we have and where the trends are taking us. Processed food is generally much more affordable and in recent years the intake of processed food has increased dramatically by about almost 50% (Racco, 2018, para.1). The foods we need to maintain or increase our health are getting more expensive. The health situation experienced by those living in northern or remote regions is a direct consequence of eating unhealthy. The next blog post will discuss the long term health consequences of not eating healthy. ReferencesAlberta Government (2018). Consumer Price Index Change [Graph]. Retrieved from https://economicdashboard.alberta.ca/ConsumerPriceIndexChange
Kenny, T. A., Fillion, M., MacLean, J., Wesche, S. D., & Chan, H. M. (2018). Calories are cheap, nutrients are expensive–The challenge of healthy living in Arctic communities. Food Policy, 80, 39-54. Murray, N. (2018, October 19). 'Tokenism and optics': Inuit orgs slam feds on Nutrition North consultations. Retrieved from https://www.cbc.ca/news/canada/north/inuit-groups-indigenous-working-group-nutrition-north-1.4869314 Racco, M. (2017, December 5). Canadians, especially kids, get half their daily calories from ultra-processed foods. Retrieved from https://globalnews.ca/news/3898015/canada-kids-processed-food/ Ross, S. (2018, November 28). Price of potatoes expected to go up, says P.E.I. grower. Retrieved from https://www.cbc.ca/news/canada/prince-edward-island/pei-potato-harvest-prices-shortage-1.4923905 Statistics Canada (2018). Consumer Price Index, monthly, not seasonally adjusted, Canada, provinces, Whitehorse and Yellowknife — Food [Table]. Retrieved from https://www150.statcan.gc.ca/t1/tbl1/en/tv.action?pid=1810000403 Subnath, M. (2017). Indigenous Food Insecurity in Canada: An Analysis Using the 2012 Aboriginal Peoples Survey. Retrieved from https://ir.lib.uwo.ca/cgi/viewcontent.cgi?article=6275&context=etd Food Security and the Social Order IntroductionThis past weekend, 30,000 people rioted and Paris burned in response to a 23% increase in fuel and 3.9-7.6 cent increase hydrocarbon fuel taxes by the French Government (Read, 2018, paras. 5-7). What hasn't been discussed is the effect which increased fuel prices and taxes have on the social order. SYF has noted a similar pattern in history and our perspective is from a food based perspective. Lloyd's of LondonLloyd’s of London commissioned their analysts to determine the impact the insurance industry would have from prohibitive food prices. Titled, “Food System Shock: The insurance impacts of acute disruption to global food supply,” details the conditions that would cause food prices to spike and its effects on the social order. Prohibitive food prices would impact the social order in the form of rioting, unrest, and damage (Lloyd's, 2015, p. 7). Presently, the food system is a complex machine that is under continual stress from economic, political, and environmental actions and events. Setting the Table Our third blog post detailed a major loss that the EU has not really recovered from. In February of 2017, a series of extreme weather events resulted in the loss of nearly 80% of fruits and vegetables in Southern Europe. This led to an initial doubling of prices and shortage of produce. The U.S. was sourced as an alternative but there were no surplus to be shared. As time progressed, there was a quadrupling of prices, controls on how much could be purchased, and establishment of a black market for produce. To remedy these conditions, the E.U. sought to relax import regulations to import produce from North Africa. In this atmosphere, prices for produce has remained somewhat elevated since that time. The Food Price Index for France has shown that prices for food has remained on par with the country’s inflation rate for June and July before rising above for August and September. The black line and blue shaded area is the forecast trend going forward for the price of food while the blue bars represent the months. With the coming implementation of additional taxation, it will be interesting to observe the response by people and resultant increase in prices. Arab Spring In late 2010 and continuing into 2011, a series of unrest, protests and rioting across North Africa and the Middle East resulted in regime changes, called the Arab Spring. Researchers have noted a correlation between increasing food prices and social unrest. Recent studies seem to confirm this assertion, rapid increases in food prices can result in social unrest (Bellmare, 2015, p.24). The cause of the Arab Spring unrest, from food price spikes, may have been the price speculation by commodities traders and diversion of corn for ethanol production (Merchant, 2015. Para. 2). In our own societies, we seek to mitigate basic needs help with social programs. We fund food banks, support food drives, and give money to organizations who work with those experiencing need. This safety net helps to keep people fed one wonders if those regimes that changed hands would not have done so with similar social programs we employ. ConclusionThere is a historical analog to rioting in France and is something to consider for what is occurring in France. Previous to the start of the French Revolution, the price of bread, which was a staple, shot up to 88% of a worker’s wage (Bramen, 2010, para.4). The sustained increase in fuel prices and taxes will make everything cost more and it is likely that the French people have had enough. As prices continue to increase, what kind of social pressure can we expect here as prices become hard to sustain? What can be done to lessen the effect of ever increasing prices? From a government and economic perspective, without the commodity controls established after the depression, it is likely that rapid price increases will result in social disorder (Merchant, 2015, para.14). Individually, these trends may very well urge society to grow their own food once more. ReferencesBellemare, M. F. (2015). Rising food prices, food price volatility, and social unrest. American Journal of Agricultural Economics, 97(1), 1-21. Retrieved from https://academic.oup.com/ajae/article/97/1/1/135390
Bramen, L. (2010, July 14). When Food Changed History: The French Revolution. Retrieved from www.smithsonian.com Bresson, T. (2018). Mouvement des gilets jaunes, Andelnans, 24 Nov 2018 [Photograph]. Retrieved from https://www.flickr.com/photos/computerhotline/45314995274/in/photolist Lloyd's (2015). Food System Shock. Retrieved November 28, 2018 from https://www.lloyds.com/~/media/files/news-and-insight/risk-insight/2015/food-system-shock/food-system-shock_june-2015.pdf Merchant, B. (2015). Commodity Traders Helped Spark the War in Syria, Complex Systems Theorists Say. Retrieved November 28, 2018 from https://motherboard.vice.com/en_us/article/wnxe4y/commodities-traders-helped-spark-the-war-in-syria-complex-systems-theorists-say Read, C. (2018, November 24). PARIS BURNS: Riot police fire tear gas as 30,000 protesters furious at Macron hit France. Retrieved from https://www.express.co.uk/news/world/1049731/France-protests-paris-riots-police-emmanuel-macron-latest-france-news Trading Economics (2018). France Food Inflation Forecast [Graph]. Retrieved from https://tradingeconomics.com/france/food-inflation Production woes and extreme weather DifficultiesAcross the world, the indicators we follow have shown a decrease in food production. We observe regional news reports which all seem to have a similar theme, the cost of extreme weather and declining food production. In both hemispheres, the 2018 growing season has resulted in downward declines of projections. One class of crops we follow is wheat, as it is one of the main staples of our diet. Wheat production and grains as a whole is decreasing worldwide. According to the USDA’ World Agricultural Supply and Demand Estimates (WADSE), the 2017/18 to 2018/19 wheat production has decreased while use (consumption) has increased (USDA, 2018, WADSE-581-8). Hemispheres In the Southern Hemisphere, Australia has experienced the lowest production in decades due to an extensive drought (Thukral & Barrett, 2018, para.8). Malawi, and Zimbabwe experiences sub average numbers due to insufficient moisture during critical times (Demaree-Saddler, 2017, para.7). Bread baskets across the Northern Hemisphere has suffered similar conditions as their numbers has been reduced. Last year, world wheat production was a surplus due to a bumper crop in Russia while this year India produced a number crop that buoyed global production numbers (Donley, 2018, para.1). Initially, Russia's forecasted similar numbers from 2017 but those expectations were dashed in June (Devitt, 2018, paras. 3-5). Spring wheat production in the U.S. was projected to be the smaller in a hundred years (Parkin & Newman, 2018, para.2). In Canada, our production has dropped 3.3% from last year (Skerritt, 2018, para.2). AlbertaSpring planting was delayed to due to cold and wet conditions in mid to late spring. As the summer came to end the province was still in a state of moderate to extreme drought (Shooshtarian, 2018, para.2). Provincial harvest was delayed by wet and cold conditions which resulted in 70% of the harvest left in northwest fields, around 50% in central and northeast regions and 29% left in the south (Shooshtarian, Table 1, 2018, para.2). Going forward As a whole, our focus on wheat is meant for understanding and the inclusion of other grains into the discussion highlight this negative trend even more. According to the WADSE, total grains show production declining and use increasing. As a result, carryover stock is declining and this has resulted in some interesting things occurring. When grains are classified, those with a high nutritional content are designated for human consumption while low nutritional content are meant for feed for animals. The Ukraine has reduced the number of classes for wheat from six to four (Polityuk, 2018, para.1). No rationale was given but a reduction from five classes to three for human consumption is something to note. Another occurrence which we have observed is the grains that are grown are being kept within the countries which is being produced. The European Union and Russia is contemplating the restriction of exports of wheat (Norton, 2018, Wheat, para.1). The result of these occurrences impacts trade and also increases the world price for grains. If present trends continue, we expect reclassifications and export controls to become more common. This will most likely have the effect of increasing food prices. We are reminded of the Lloyds of London’s Food Shock report where extreme weather events occur in breadbasket resulting in prohibitive food price increases and unavailability. Our next report will detail this report along with commentary on the Canadian Food Price Index. References
Demaree-Sadler, H. (2018, September 21). Conflicts, climatic shock exacerbated food insecurity. World Grain. Retrieved from http://www.world-grain.com Norton, A. (2018, September 2). Russian wheat export restriction expected. Agweek. Retrieved from http://www.agweek.com/ Parkin, B. & Newman, J. (2018, January 12). U.S. Winter Wheat Planting Touches Century Low. Wall Street Journal. Retrieved from http://www.wsj.com/ Shooshtarian, A. (2018). Crop Conditions as of October 9, 2018 (Abbreviated Report). Retrieved from Alberta Agriculture and Forestry website: http://www1.agric.gov.ab.ca/$Department/deptdocs.nsf/all/sdd16741 Skerritt, J. (2018, August 31). ‘Shock’ estimates on Canadian wheat, canola crops boost prices. Business News Network Bloomberg. Retrieved from http://www.bnnbloomberg.ca/ Statistics Canada (2018). Estimated areas, yield, production, average farm price and total farm value of principal field crops, in metric and imperial units. Retrieved from https://www150.statcan.gc.ca/t1/tbl1/en/tv.action?pid=3210035901 Thukral, N. & Barrett, J. (2018, May 1). Australian wheat farmers plant in dust bow and pray for rain. Reuters. Retrieved from http://www.reuters.com/ U.S. Department of Agriculture (2018). World Agriculture Supply and Demand Estimates. Retrieved from https://www.usda.gov/oce/commodity/wasde/latest.pdf A Difficult StartIntroductionConditions at the end of the 2017 Alberta harvest were in some cases below normal and above normal. Two of the main staple wheat crops, 86% of Hard Red Spring Wheat and 85% Durum Wheat were above the five year average for quality (Shooshtarian, 2017, para.2). Statistics Canada data estimates a 5% increase for wheat, excluding Durum (Statistics Canada, Wheat (excluding Durum), para.1) and Durum will fall 23% from last year (Statistics Canada, Durum, para.2). Prices for both are expected to rise later this year. Why food prices will rise might be due to the drought conditions which affected winter wheat. Sub-surface moisture content was considered below average in the southern parts of the province and above average in the north (Shooshtarian, 2017, Regional Assessments). Moisture conditions across the southern prairie provinces are rated below average and recovering from drought conditions (Arnason, 2017, para.4). Harvest SouthHarvest has concluded within growing regions in the Southern Hemisphere. Despite increasing acreage (fall 2017) to boost production totals for their growing season, Argentina has suffered drought conditions which has resulted in the costliest agriculture disaster to date, to the tune of $3.4 billion dollars (Masters, 2018, para.2). South Africa wheat production has fallen 23% from last year (Mchunu, 2018, para.5). Australia wheat has dropped 36% (Reidy, 2018, para.2). The Southern growing regions have all mostly experienced drought conditions during the maturing phase along with early frost and/or wet conditions hampering harvesting. ProjectionsThe Food Agriculture Organization (FAO) of the United Nations has forecasted the 2018-2019 growing season for wheat worldwide to contract by 1% (750 million tons). The United State’s Department of Agriculture’s WADSE Report also reflects this number as well (USDA, 2018, P.8). Canadian estimates for the 2018-2019 growing season is forecasted to increase by 5% for Durum (Statistics Canada, Durum, p.2) and 4% for wheat, excluding Durum (Statistics Canada, Wheat (excluding Durum), p.3). Russian wheat production is expected to decline by 7.7% this year (Donley, 2018, para.1). Going ForwardDrought conditions during the previous years can impact winter and spring crops which has resulted in the current numbers and downward revisions of forecasts. The downward production of most growing regions is a disturbing trend and at the end of next year will be telling if this is a long term trend. What was not accounted for in the current forecasts is the delay that the Northern Hemisphere farming is experiencing due to cold or heat. Cold and wet conditions are hampering most major crops due to not being able to seed when the ground is not dry (Heard, 2017, para.17). Russian plantings are experiencing near drought conditions and it is hoped that rains will come (Gartner, 2018, para.2). Across the states and Canada, weather woes are preventing planting and the planting of shorter term duration crops, abandoning wheat, will result in lower production numbers for wheat later this year (Gartner, 2018, paras 3-4). This graph was included in last’s year summary at the end of harvest and bears more consideration. 2017’s number is lower than the initial start in 2013 and also lower than the five year average. 2018’s projected numbers are around 4% but with plantings being delayed or abandoned we might see worse numbers going ahead. It will be interesting to see how production numbers turn out. The effect that winter had on winter wheat growing and spring wheat planting has the effect of increasing wheat prices. Should these prices continue to be elevated, it will have the effect of increasing prices for foods that use wheat. Other classes of growth are experiencing difficulties in growing and we will continue to monitor and report on what we observe. We hope that by knowing why price for foods are increasing that this will motivate you to do something. We can suggest and provide resources for you to do this. For example, your house is a stable growing environment and you can start by growing indoors utilizing a southward facing window. Also, if you have land then you can modify the landscape around your home to include fruit bearing trees and bushes, along with a garden. One could go the extra step of building a year round producing greenhouse, one which we have developed. In the coming posts, we will show you how to accomplish this. Stay tuned and happy growing to you! ReferencesArnason, R. (December 14, 2197). Prairies remain dangerously dry. The Western Producer. Retrieved from https://www.producer.com/2017/12/prairies-remain-dangerously-dry/
Donley, A. (April, 27, 2018). Russia grain output to fall in 2018-19.World-Grain. Retrieved from http://www.world-grain.com/articles/news_home/World_Grain_News/2018/04/Russia_grain_output_to_fall_in.aspx?ID=%7BB15AB037-BAD9-45F3-B0EE-88BB7B01F347%7D Gartner, L. (April 27, 2018). Wheat Gets Another Rally On Weather Concerns. Agriculture.com. Retrieved from https://www.agriculture.com/markets/analysis/wheat-gets-another-rally-on-weather-concerns Heard, G. (April 15, 2018). US, Aussie concerns give hope for wheat price rise. Goondiwindi Argus. Retrieved from https://www.goondiwindiargus.com.au/story/5342712/us-aussie-concerns-give-hope-for-wheat-price-rise/ Masters, J. (March 30, 2018). Most Expensive Weather Disaster of 2018: a $3.9 Billion Drought in Argentina and Uruguay. Weather Underground. Retrieved from https://www.wunderground.com/cat6/most-expensive-weather-disaster-2018-39-billion-drought-argentina-and-uruguay Mchunu, S. (January 22, 2018) Decline in wheat production will not affect food prices. Business Report. Retrieved from https://www.iol.co.za/business-report/economy/decline-in-wheat-production-will-not-affect-food-prices-12847050 Reidy, S. (February 13, 2018). Australian wheat production drops 38%. World-Grain. Retrieved from http://www.world-grain.com/articles/news_home/World_Grain_News/2018/02/Australian_wheat_production_dr.aspx?ID=%7B2212260E-A210-40ED-91CC-442082D45846%7D U.S. Department of Agriculture (2018). World Agricultural Supply and Demand Estimates. Retrieved from https://www.usda.gov/oce/commodity/wasde/latest.pdf Shooshtarian, A. (2017). Crop Conditions as of October 31, 2017 - Final Report of 2017. Retrieved from Alberta Agriculture and Forestry website: http://www1.agric.gov.ab.ca/$Department/deptdocs.nsf/All/sdd16511 Statistics Canada (2018). Canada: Outlook for Principal Field Crops (Crops). Retrieved from http://www.agr.gc.ca/resources/prod/doc/misb/mag-gam/fco-ppc/fco-ppc_2018-04-23-eng.pdf Grave ImplicationsIntroductionThis past summer, it was reported that protected areas in Germany experienced a significant die off of insects over the last 27 years. What makes this unsettling is this area is a nature preserve, meaning it was protected from the use of pesticides and monocrop farming practices (Hallman, 2017, p.15-16). It is not known why this is occurring but some of the tools we use in pest and plant management might be responsible. These protected areas are rich in diversity of plants and you would expect that local insect and bee populations would thrive in this environment but this is not the case. It is estimated that in some years, the die off of insect biomass ranges as high as 75% (Hallman et al., 2017, p.14)! This has grave implications within the food chain, as insect do much work where we benefit from. It is estimated that 80% of wild plants are pollinated by insects (Ollerton, Winefree, & Tarrant, 2011, p.322) and 60% of birds rely on insects as a source of food (Morse, 1971, p.177). One group of insects that do much work in food production is the honey bee. Bee ProblemThe diversity in our food products has much to do with the service that honey bees perform in collecting nutrients and food for their colony. In the process of performing these acts they pollinate plants which allows for the further plant development. Human and bees benefit from this symbiosis, where bees gain nutrients for their colony and we get a diversity of crops but this relationship is at risk. For a number of years the sustainability of bee populations has been under continual threat by Colony Collapse Disorder (CCD). CCD is characterized as the massive loss of worker bees from a colony which cannot sustain it population (Evans, 2009, p.1). Neonicotinoid or Neonics are a class of pesticides, chemically similar to nicotine, which are highly toxic to insects, acting on their nervous system. There is much debate over the role that Neonics have in the possible cause of CCD. Health Canada is set to ban Imidacloprid this December (Booker, 2018, para. 3) and set to rule on the remaining pesticides in 2020 (Booker, 2018, para.4). Despite this, Agriculture Canada, Ducks Unlimited, and other stakeholders initiated a study which asserted that a Neonic ban is not supported by the study’s data (Booker, 2018, para.10). In opposition to this, the European Food Safety Authority has determined that a ban on these class of pesticides is needed and may vote on this ban next week (Butler, 2018, paras.1-2). Neonics persistence in the environment is in terms of decades and most concerning is that this persistence may be cumulative. Clothianidin, a Neonic, has been found to have a half life of 19 years (Wood & Goulson, 2017, p.17292) and if we stopped right this minute it would take the soil over a century to rehabilitate! What can be done?To create a haven for insect and bees, it will be necessary to stop using herbicides and pesticides in your living area. Also, if you live near a park it’s likely they are using these chemicals which are harmful to insects. We must lobby local government to stop spraying within parks and take a more environment friendly approach to plant and insect management. More closer to home, considering planting bee friendly plants around your home. Urban areas where farm pesticides are not present can make these areas a haven for these pollinators. This news report suggests the planting of the Pasque flower, common to our region and extremely bee friendly (Wilson, 2017, paras. 11-12). These are ways you can act to provide a safe and abundant way for insects and bees to continue their activities of which we benefit from. ReferencesBooker, R. (2018, March 9). Study says neonicotinoid ban not the answer. Western Producer. Retrieved from https://www.producer.com/2018/03/study-says-neonicotinoid-ban-not-answer/
Butler, D. (2018, February 28). EU expected to vote on pesticide ban after major scientific review. Nature. Retrieved from https://www.nature.com/articles/d41586-018-02639-1 Evans, J. D., Saegerman, C., Mullin, C., Haubruge, E., Nguyen, B. K., Frazier, M., ... & Tarpy, D. R. (2009). Colony collapse disorder: a descriptive study. PloS one, 4(8), e6481. Hallmann, C. A., Sorg, M., Jongejans, E., Siepel, H., Hofland, N., Schwan, H., ... & Goulson, D. (2017). More than 75 percent decline over 27 years in total flying insect biomass in protected areas. PloS one, 12(10), e0185809. Morse, D. H. (1971). The insectivorous bird as an adaptive strategy. Annual Review of Ecology and Systematics, 2(1), 177-200. Ollerton, J., Winfree, R., & Tarrant, S. (2011). How many flowering plants are pollinated by animals?. Oikos, 120(3), 321-326. Wilson, K. (2017, May 19). Planting bee-friendly gardens can help bee populations in southern Alberta. Global News. Retrieved from https://globalnews.ca/news/3466162/planting-bee-friendly-gardens-can-help-bee-populations-in-southern-alberta/ Wood, T. J., & Goulson, D. (2017). The environmental risks of neonicotinoid pesticides: a review of the evidence post 2013. Environmental Science and Pollution Research International, 24(21), 17285. YEAR WITHOUT A SUMMERContextThe Secure Your Food Program Rationale is based on the perspective that food production is negatively affected by extreme weather. On the list of potential types of events which may increase extreme weather is the effect of aerosols from erupting volcanoes. The main cause is Sulphuric Acid which at the stratospheric levels, reflect solar energy from the earth. This reflection of sunlight, at these levels, can result in colder temperatures worldwide. Mount Pinatubo, in the Philippines, erupted in 1991 and pushed gases into the stratosphere resulting in an estimated -0.5 degree Celsius temperature decrease worldwide (Self, Zhao, Holasek, Torres, & King, 1993, Introduction, para.3). This resulted in more extreme weather and has been thought to be a formative influence behind the 1993 winter storm which hit the eastern U.S. (Stevens,1993,12-13). Year without a summerIn April of 1815, Mount Tambora violently exploded with six times the force of Pinatubo, ejecting as much gases into the stratosphere (Oppenheimer, 2013, p.234). Also, volcanic eruptions on the equator tend to distribute around the globe as opposed to eruptions in the North which distribute regionally or within that hemisphere. The gases from the eruption mixed with moisture in that level of our atmosphere and became acid rain. This would have the effect of reflecting sunlight away from our planet. The result of this was the year without a summer in 1816 and along with this was the recorded failures in crop production which led to starvation and death (Oppenheimer, 2013, p.244). What can we expect?The trend for volcanic activity has been steadily rising and interestingly enough in concert with earthquake activity. Current graphs are illustrating an increase of 3x-4x since the 1900’s and it would seem that volcanic activity appears to be increasing (Doocy, Daniels, & Dooling, 2013, Figure 2). This means the likelihood of a major eruption event that will affect world wide temperature is likely. Volcanic eruptions are classified according the to the Volcanic Explosivity Index (VEI). Mt. Pinatubo’s VEI was considered to be 6 on a scale of 1-7, where a VEI of seven is an eruption from a Super Volcano, of which the Yellowstone Caldera’s past eruptions qualify for this classification (United States Geological Survey, 2017, Figure 1). If we have a major volcano with a VEI index of 4 or above, it will affect global temperature and result in negative food production. In recent years, SYF has considered growing outdoors to be a gamble and considers that a combination of systems resulting in good growing conditions are not assured. This is why SYF proposes to take growing indoors where the climate is stable and somewhat optimal. Read our last blog on how you can start container growing indoors. February 21, 2018 updateFebruary 19, 2018 Sinabung EruptionMount Sinabung exploded on Monday, losing a large part of its summit and also propelling ejecta into the upper atmosphere. Experts are still mulling over the severity of the explosion with the ratings of 3-5 on the VEI scale still being determined. SYF expects that extreme weather conditions will be exacerbated as result of the prolonged fallout from this eruption. *Update : The Sinabung eruption did not reach the stratosphere according to new estimates and will not be affecting global climate. Initial estimates reported 16.5 KM height which would have been in the stratosphere were it at that height. This is a good thing. Thanks to Jeff Q for the heads up.* This combined with the projected losses in food production this coming growing season highlight the need to take personal responsibility over the production of food for yourself and your family. SYF will be a resource to this by showcasing and highlighting ways to accomplish this. For example, indoor container growing is something we discussed in our last blog post and is something that you can start today. Prepare accordingly and good luck! ReferencesDoocy, S., Daniels, A., & Dooling, S. The Human Impact of Volcanoes: a Historical Review of Events 1900-2009 and Systematic. Retrieved from http://currents.plos.org/disasters/article/the-human-impact-of-volcanoes-a-historical-review-of-events-1900-2009-and-systematic-literature-review/
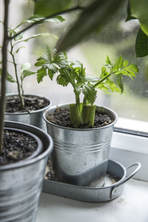
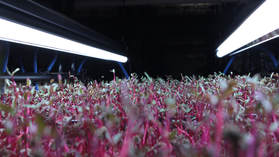
Oppenheimer, C. (2003). Climatic, environmental and human consequences of the largest known historic eruption: Tambora volcano (Indonesia) 1815. Progress in physical geography, 27(2), 230-259. Self, S., Zhao, J. X., Holasek, R. E., Torres, R. C., & King, A. J. (1993). The atmospheric impact of the 1991 Mount Pinatubo eruption. Retrieved from https://pubs.usgs.gov/pinatubo/self/ Stevens, W.K. (1993). THE BLIZZARD OF '93: Meteorology; 3 Disturbances Became a Big Storm. N.Y. Times. Retrieved from http://www.nytimes.com/1993/03/14/nyregion/the-blizzard-of-93-meteorology-3-disturbances-became-a-big-storm.html U.S. Geological Survey (2017). VEI. Retrieved from https://volcanoes.usgs.gov/vsc/glossary/vei.html SECURING YOUR FOOD SOVEREIGNTY IntroductionExtreme weather is beginning to negatively impact food production and it is time to think about climate change adaptations. We have illustrated that the areas we source for fruit and vegetables, during the winter, are experiencing difficulties in growing quality and quantity of produce. This will result in increased food prices and the question is now, how can we mitigate or lessen these effects? Indoor Growing When you think about it, your house provides you with a stable climate where humidity and temperature are already controlled. Why not change your lifestyle a tiny bit by growing inside. This can be accomplished by utilizing a southward facing window along with grow LED lights, especially during the winter. Once you have a place set aside for growing, the question remains how and what to grow. Container Growing Container growing can be a simple as a potted plant or more serious as a polypropylene grow bag. This depends on your ability to manage the plant that you are growing. If your abilities are hampered by disability, you can grow in containers that can fit within a small space. Plants like herbs or salad greens can be a good place to start from. When you begin to get more confident about growing you can progress to other plant species such as peppers, beans, or determinate tomatoes. This article provides information on growing indoors with useful information. Fast and Nutritious AlternativesContainer growing is something that we may be used to but there are alternate forms of growing which can be as fun and more nutritious.
TakeawayWhen you start to grow your own food, you will feel a sense of achievement and hopefully, this will move you to be more active in growing your own food. When you grow your own food you will be more food secure and increase your food sovereignty.
Food sovereignty according to Food Secure Canada, “...is the right of peoples to healthy and culturally appropriate food produced through ecologically sound and sustainable methods, and their right to define their own food and agriculture systems." Simply by the act of growing your own food that is relevant to you, you increase the food sovereignty and food security of you and your own family. This is how you prepare for the coming food shocks. Resource Links: Food Sovereignty https://foodsecurecanada.org/who-we-are/what-food-sovereignty Spirulina Growing http://www.spirulinaacademy.com/grow-your-own-spirulina/ Microgreen Cultivation https://www.gardeningchannel.com/how-to-grow-microgreens-101/ Container Growing Indoors https://www.gardeners.com/how-to/urban-gardening-with-vegetables/5491.html ContextLast February in Europe, we noted the series of extreme weather events which resulted in produce becoming scarce and eventually unavailable til spring. This near total loss of capacity strained the regional capacity of the distribution system and eventually resulted in the sourcing of alternative food sources from North Africa. Winter ShockThe current shock has been made worse by this past summer’s heat and hurricane woes which resulted in increase for produce (Hawkes, 2018, Adding to Damage, paras. 1-3). Current Statistics Canada numbers for 2017 in the classes of food is still not available but the general price for food is stated to be 1.6% rise from last year (Statistics Canada, 2018, Cansim table 326-0020). The map above is the current picture of temperatures across North America and we are a witness to reports in the media of storms, snow, hail, and cold temperatures across the southeastern states. These states produce the fruits and vegetables we consume during the winter months and they have taken a shotgun blast of cold air and weather. Growers in the Texas region are determining their loss in the wake of sub zero temperatures this past week (Hawkes, 2018, Worst Nightmare, para.1). Further south in Mexico, the picture is the same and there is the concern that citrus trees may have been affected resulting in harvest concerns (Hawkes, 2018, Cold in Mexico, paras. 1-3). This shock has also affected infrastructure in a negative way, with distribution and transportation components of the food chain system breaking down. Added RiskThe distribution system in which our food is distributed is called the Just In Time delivery system. Based on past purchases, a forecast is developed and is why grocers no longer keep food stocks. Food is delivered just in time to fill the need and in this system any delays can result in shortages. Significant delays and regional shortages of food products, mainly fruits and vegetables, are occurring because transportation is finding it difficult to transport, simply for the reason of not knowing how to drive in winter conditions. "Even if you think you want to go out ... to go to the grocery store, the truth is they haven't been able to be resupplied. So, just wait," said Harris County Texas Judge Ed Emmett (Park, 2018, para.18). There is discussion around the impact that climate has upon systems we rely to deliver food. They conclude that we must make pro-adaptive measures to infrastructure, in advance of increasing extreme weather which will result in lower costs (Schweikert, Chinowski, Espinet, & Tarbert, 2014, p.314). To conclude, we are seeing that extreme winter conditions are affecting the ability to transport and distribute food resulting in shortages. This means shortages and rising costs for fruits and vegetables. You are going to hear of this term as we move forward and this is “climate change adaptation.” We must think how we can adapt to ever increasing extreme weather and in terms of food, it might simply be growing some food inside your house. Next blog post we will explore indoor growing. Derek Melting Tallow Program Director, Secure Your Food ReferencesCropley, J. (2018, January 4). Sustained cold crimps propane supply for some: Homeowners finding
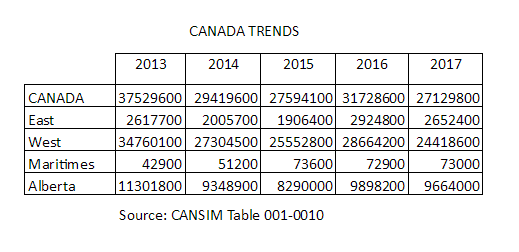
delays getting refills. Daily Gazette. Retrieved from Hawkes, L. (2018, January 15). Plunging temps, hard freezes trouble Texas, Mexico vegetable farmers. Southwest FarmPress. Retrieved from http://www.southwestfarmpress.com/weather/plunging-temps- hard-freezes-trouble-texas-mexico-vegetable-farmers Park, M. (2018, January 14). South sees snow, frigid temperatures and slippery roads. CNN. Retrieved from http://www.cnn.com/2018/01/17/weather/apple-news-south-weather/index.html Schweikert, A., Chinowsky, P., Espinet, X., & Tarbert, M. (2014). Climate change and infrastructure impacts: comparing the impact on roads in ten countries through 2100. Procedia Engineering, 78, 306-316. Statistics Canada (2018). Consumer Price Index, by province (monthly) (Canada). Retrieved from http://www.statcan.gc.ca/tables-tableaux/sum-som/l01/cst01/cpis01a- eng.htm GLOBAL AND NATIONAL SUMMARYGLOBALOverall, the growing season for crops has been a mixed bag depending on where one is on the planet. Worldwide, it was expected that extreme weather would impact production and this trend has played out. In this summary, we will be focusing on wheat production, the staple food of the world. According to the US Department of Agriculture (USDA), global food production this year settled at 753 million metric tons, 18 million metric tons more than 2016 (USDA, 2017,p.18-19). In 2018, it is expected that production will fall by a couple of million tons. U.S. wheat production increased 11% over last year and is expected to drop 25% for next year (USDA, 2017, p.11). European wheat production declined 10% (Bryant-Erdmann, 2017, Quality Reports, para. 6). Russian wheat production is a boon to the 2017 numbers, an increase of 18% over last year (Bryant-Erdmann, 2017, Quality Reports, para. 10). In the Southern Hemisphere, drought and excessive rain has resulted in the downward revision of crop production during the present growing season. Australia is expected to increase production but concerns about extreme weather affecting nutritional quality are growing (Bryant-Erdmann, 2017, Southern Hemisphere Wheat Development, para. 5). Argentina is suffering the same weather problems but increased land utilization of 10.6 million acres will result in a forecast of 19% increase from last year (Bryant-Erdmann, 2017, Southern Hemisphere Wheat Development, para. 2). NATIONALThis growing season was marked by extreme weather events, drought in the west and wet in the east. Current production totals for Canada are down from initial 5 year old total and 5 year average (Statistics Canada, 2017, CANSIM, Table 001-0010 ). With the exception of 2016, the trend for production is a gradual downward one. Why 2016 was different may have to do with the El Nino Southern Oscillation and the influence it has on the geographic regions on this continent (Trendberth, 2016, para. 3). Excessive rain or heat will have a negative impact on future production. Drought affected regions received around 40% of normal rainfall while wet regions received 150-200% of normal rainfall (Chadrick, 2017, para.5). Additionally, soil fertility is negatively impacted by the lack of soil moisture and leaching of nutrients in areas with too much moisture (Chadrick, 2017, para.6). This might account for the predicted decline projected for 2018 by the USDA and is also reflective of the decline trend by Statistics Canada. TAKEAWAY This downward trend for food production is certainly going to result in increasing food prices worldwide. As reported in the previous blog post concerning Canadian trends, food prices have risen in excess of 4% from last year and taken with the continuing decline in future production, this will make buying healthy more difficult. If you have resources, it is best to make preparations. SourcesBryant-Erdmann, S. (November 3, 2017). Wheat Markets Focus on Quality and Southern Hemisphere Crop Conditions. Agfax. Retrieved from http://agfax.com/2016/11/03/wheat-markets-focus-on- quality-and-southern-hemisphere-crop-conditions/ Chadrick, C. (November 16, 2017). Looking back on 2017”s biggest growing challenges. Grainews. Retrieved from https://www.grainews.ca/2017/11/16/looking-back-on-2017s-biggest-growing- challenges/ Statistics Canada (2017). Estimated areas, yield, production and average farm price of principal field crops, in metric units. Retrieved from http://www5.statcan.gc.ca/cansim/a03?lang=eng&pattern=001- 0010&p2=31 Trendberth, S. (January 4, 2016) What North America can expect from El Niño. The Conversation. Retrieved from http://theconversation.com/what-north-america-can-expect-from-el-nino-51959 U.S. Department of Agriculture (2017). World Agricultural Supply and Demand Estimates. Retrieved from https://www.usda.gov/oce/commodity/wasde/latest.pdf |
AuthorWrite something about yourself. No need to be fancy, just an overview. Archives
June 2021
Categories |










 RSS Feed